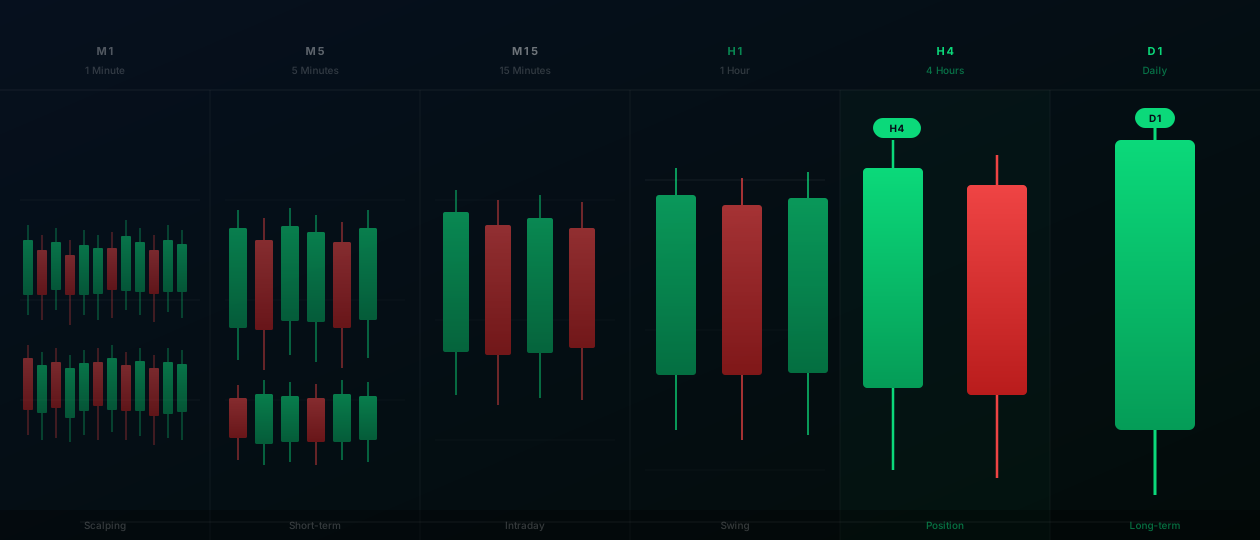
Candlestick timeframes are one of the first choices a trader makes and one of the last things they fully understand. Most traders pick a timeframe based on what they’ve seen in a tutorial or what their first broker’s platform defaulted to. Few start with a clear model of what each timeframe measures and why it might — or might not — suit their approach.
Here’s the practical map.
What a Timeframe Actually Measures
Every candlestick timeframe answers one question: what did the market do during this fixed period of time? The open, high, low, and close are the four data points that summarize all the activity — every tick, every order, every print — that occurred within the window.
Shorter timeframes give you more granularity and more noise. Longer timeframes filter the noise but slow down your feedback loop. The right choice depends entirely on how long you hold trades, how often you want to act, and how much information per bar you can process productively.
M1 and M5: The Noise Floor
One-minute and five-minute candles are the domain of scalpers — traders making many small trades in short windows, usually during high-volume sessions like the London open or New York overlap.
These timeframes generate an enormous number of bars, most of which represent noise rather than signal. Price can print a complete “engulfing” pattern on M1 that means nothing because a single market order caused it. Reading M1 and M5 requires understanding session flow and volume, not just bar patterns.
Close timing matters less here because closes happen so fast — you’re rarely waiting more than five minutes for confirmation. The skill on these timeframes is execution speed, not close analysis.
M15 and M30: Intraday Structure
Fifteen-minute and 30-minute charts are the primary timeframe for intraday traders who want more signal than M5 provides but more opportunity than H1. These timeframes are sensitive enough to show session structure (morning range, midday consolidation, afternoon break) without producing a new bar every minute.
On M15 and M30, candle close timing starts to matter. Watching a candle form into its close — knowing whether you have 14 minutes or 45 seconds remaining — tells you whether a developing pattern is real or mid-formation noise. A bearish close on M15 after a session high is a different event than the same-looking bar with 10 minutes left.
BarClock’s M15 and M30 countdown timers are most useful for traders who use these timeframes for breakout entries or session-range plays.
H1: The Intraday Anchor
The one-hour chart is one of the most widely used timeframes across retail and institutional trading. It produces 24 bars per day (forex), filtering out most intraday noise while still providing enough bars for active session analysis.
Many traders use H1 as a confirmation timeframe — watching whether a pattern on a shorter chart holds into the H1 close before committing. The H1 close becomes a meaningful data point because an hour is long enough for genuine market intent to show up.
H1 close monitoring with alerts set at T−5 or T−10 minutes works well for traders who want lead time to analyze the developing close before acting.
H4: The Core Timeframe
Four-hour candles are where BarClock delivers the most consistent value for the most traders. Here’s why.
The H4 is long enough to filter session noise — a single news spike or illiquid-hour move will show up as a shadow, not the body of the bar. But it’s short enough to provide multiple closes per trading day: six H4 candles per 24-hour forex session means six meaningful close events to evaluate.
Institutional and algorithmic trading activity frequently clusters around H4 boundaries. Position building, stop placement, and order flow often reference H4 highs, lows, and closes in ways that are visible to technical traders who know when the bar is ending.
D1: The Daily Bar
The daily candle is the most watched close in all of financial markets. Bank trading desks, asset managers, systematic funds, and retail traders across every instrument treat the daily close as the primary price point that summarizes a session.
Daily close watching isn’t about scalping or intraday timing — it’s about position review, swing trade management, and reading market sentiment at the highest useful resolution. Knowing that the daily candle closes in 45 minutes, not 4 hours, changes whether you need to act before the close or can wait for tomorrow’s open.
The D1 countdown in BarClock — with an alert set at T−30 or T−10 minutes — gives swing traders and position traders the heads-up they need to review open positions before the session’s definitive close prints.
Choosing Your Timeframe
One useful heuristic: your holding period in time should be at least 5–10 times your timeframe duration.
If you hold trades for 15–30 minutes, M1 or M5 makes sense. If you hold for 4–8 hours, H1 or H4 is your primary. If you hold for days, D1 is the bar you care about.
Equally important: pick one primary timeframe and track it consistently. Jumping between timeframes in real time to find the one that confirms what you want to see is a form of chart bias, not analysis. The timer helps you stay honest — it makes explicit how much time has elapsed in the current bar, grounding you in the timeframe you committed to.
Track the close that matters for your style. Then track it precisely.